Interactive Root Locus
User's Guide:
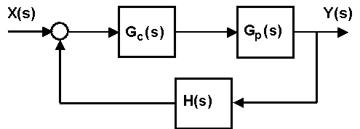
A root locus is a plot of the closed-loop poles of a system as the gain (k) varies. If a system has a "plant" of Gp and a "control" of Gc (with feedback H), then the root locus is a plot of the roots of the characteristic equation 1+GcGpH=0.

This applet plots the root locus given the coefficients of the numerator and denominator of a system. (Note: the coefficients of the system include the plant (Gp) and the control (Gc) ). The user must enter these coefficients, along with the desired range of gain (k). If any of these fields are left blank, then an error message is printed 0which prompts for the missing information.
The coefficients should be separated by spaces, such that the polynomial (s^2 + 2*s + 4) would be entered "1 2 4" (without the quotes). The gain values should be entered for the desired range, such as 0 to 10. (Note: The step size between gain values on the root locus is determined by dividing the gain range by the total number of points to plot (currently set by the program)).
To find values such as gain, time to peak, and percent overshoot, the user can click on a point on the root locus. These values will appear in the text area in the lower right corner of the applet.
To examine the changes to a root locus when poles and zeros are "dragged," the user can click and drag on any single pole or zero. The root locus will redraw itself while a pole/zero is being dragged with fewer points plotted (for speed). The full number of points are plotted when the mouse button is released.